There are already too many tools out there that kind of do what you need. And building custom tools is not as cost prohibitive as it used to be. You should go into a problem thinking that anything is feasible.
Nathan Cunningham
TLDR:
As brands grow, their supply chains become more complex. Having a scalable data pipeline that can keep up with the complexity is not just a 'nice-to-have' anymore — it's a requirement to stay competitive and meet customer expectations.
Consumers don’t care about a brand’s data infrastructure. They care about prices, selection, and availability.
But past a certain scale and complexity, great data infrastructure is required to deliver what the customer demands. Brands with dozens of suppliers, multiple fulfillment locations, and multiple channels simply can’t forecast accurately without robust data pipelines, well-maintained data lakes, and ML-driven analysis.
Nathan Cunningham runs WIPP data, a consultancy specializing in helping companies set up data infrastructure and extract insights from their supply chain data. He has built data pipelines and data analysis infra for some of the biggest and most complex companies in the world — like Tesla, Ingersoll Rand, and Trane, as well as many satisfied clients in manufacturing, telecom, and industrial services.
Here are 5 of his tips for how companies can avoid scope creep and cost overruns when scoping supply chain data projects:
1️⃣ Start with your 'Why'
Building a data pipeline is not particularly helpful unless you know very clearly why you're doing it. Typically, your 'why' will come down to one of a few options:
Revenue
Profit
Cash
Customer Satisfaction
Employee Satisfaction; or
Company Mission
Data infrastructure tends to be somewhat rigid, and changes can be expensive. So if you aren’t clear on what you’re trying to measure or forecast, you’ll build the wrong thing.
Be extremely clear about what your goals are going in.
2️⃣ Don't boil the ocean
Many COOs and CFOs dream of The One Dashboard where they can see the health of their entire operation in one place.
But under the hood, getting clean, reliable data for each stat on a dashboard can be a lot of work. A lot of the stats that seem great end up not being as useful as you’d think.
Instead of trying to build backwards from the grand vision, try to pick 2-3 areas that are the most urgent, and bite those off first. Execute those to your satisfaction, then move on to the area with the next-highest ROI.
For example, if your ‘why’ is to improve customer satisfaction, and you want to reduce risk in your supply chain, then the few areas of focus for your data pipeline could be number of qualified suppliers, supplier relationship management, and contingency plans. Focus your data pipeline on that.
3️⃣ The tool should come last
Most operators implement their data pipeline like this:
❌
Identify an area of need (”Better forecasting”)
Find software or tools
Refine the use case based on what the tool can do
For most situations, steps 2 and 3 are flipped. The order should be like this:
✅
Identify an area of need (”Better forecasting”)
Refine the use case to exactly what you need
Find software or tools
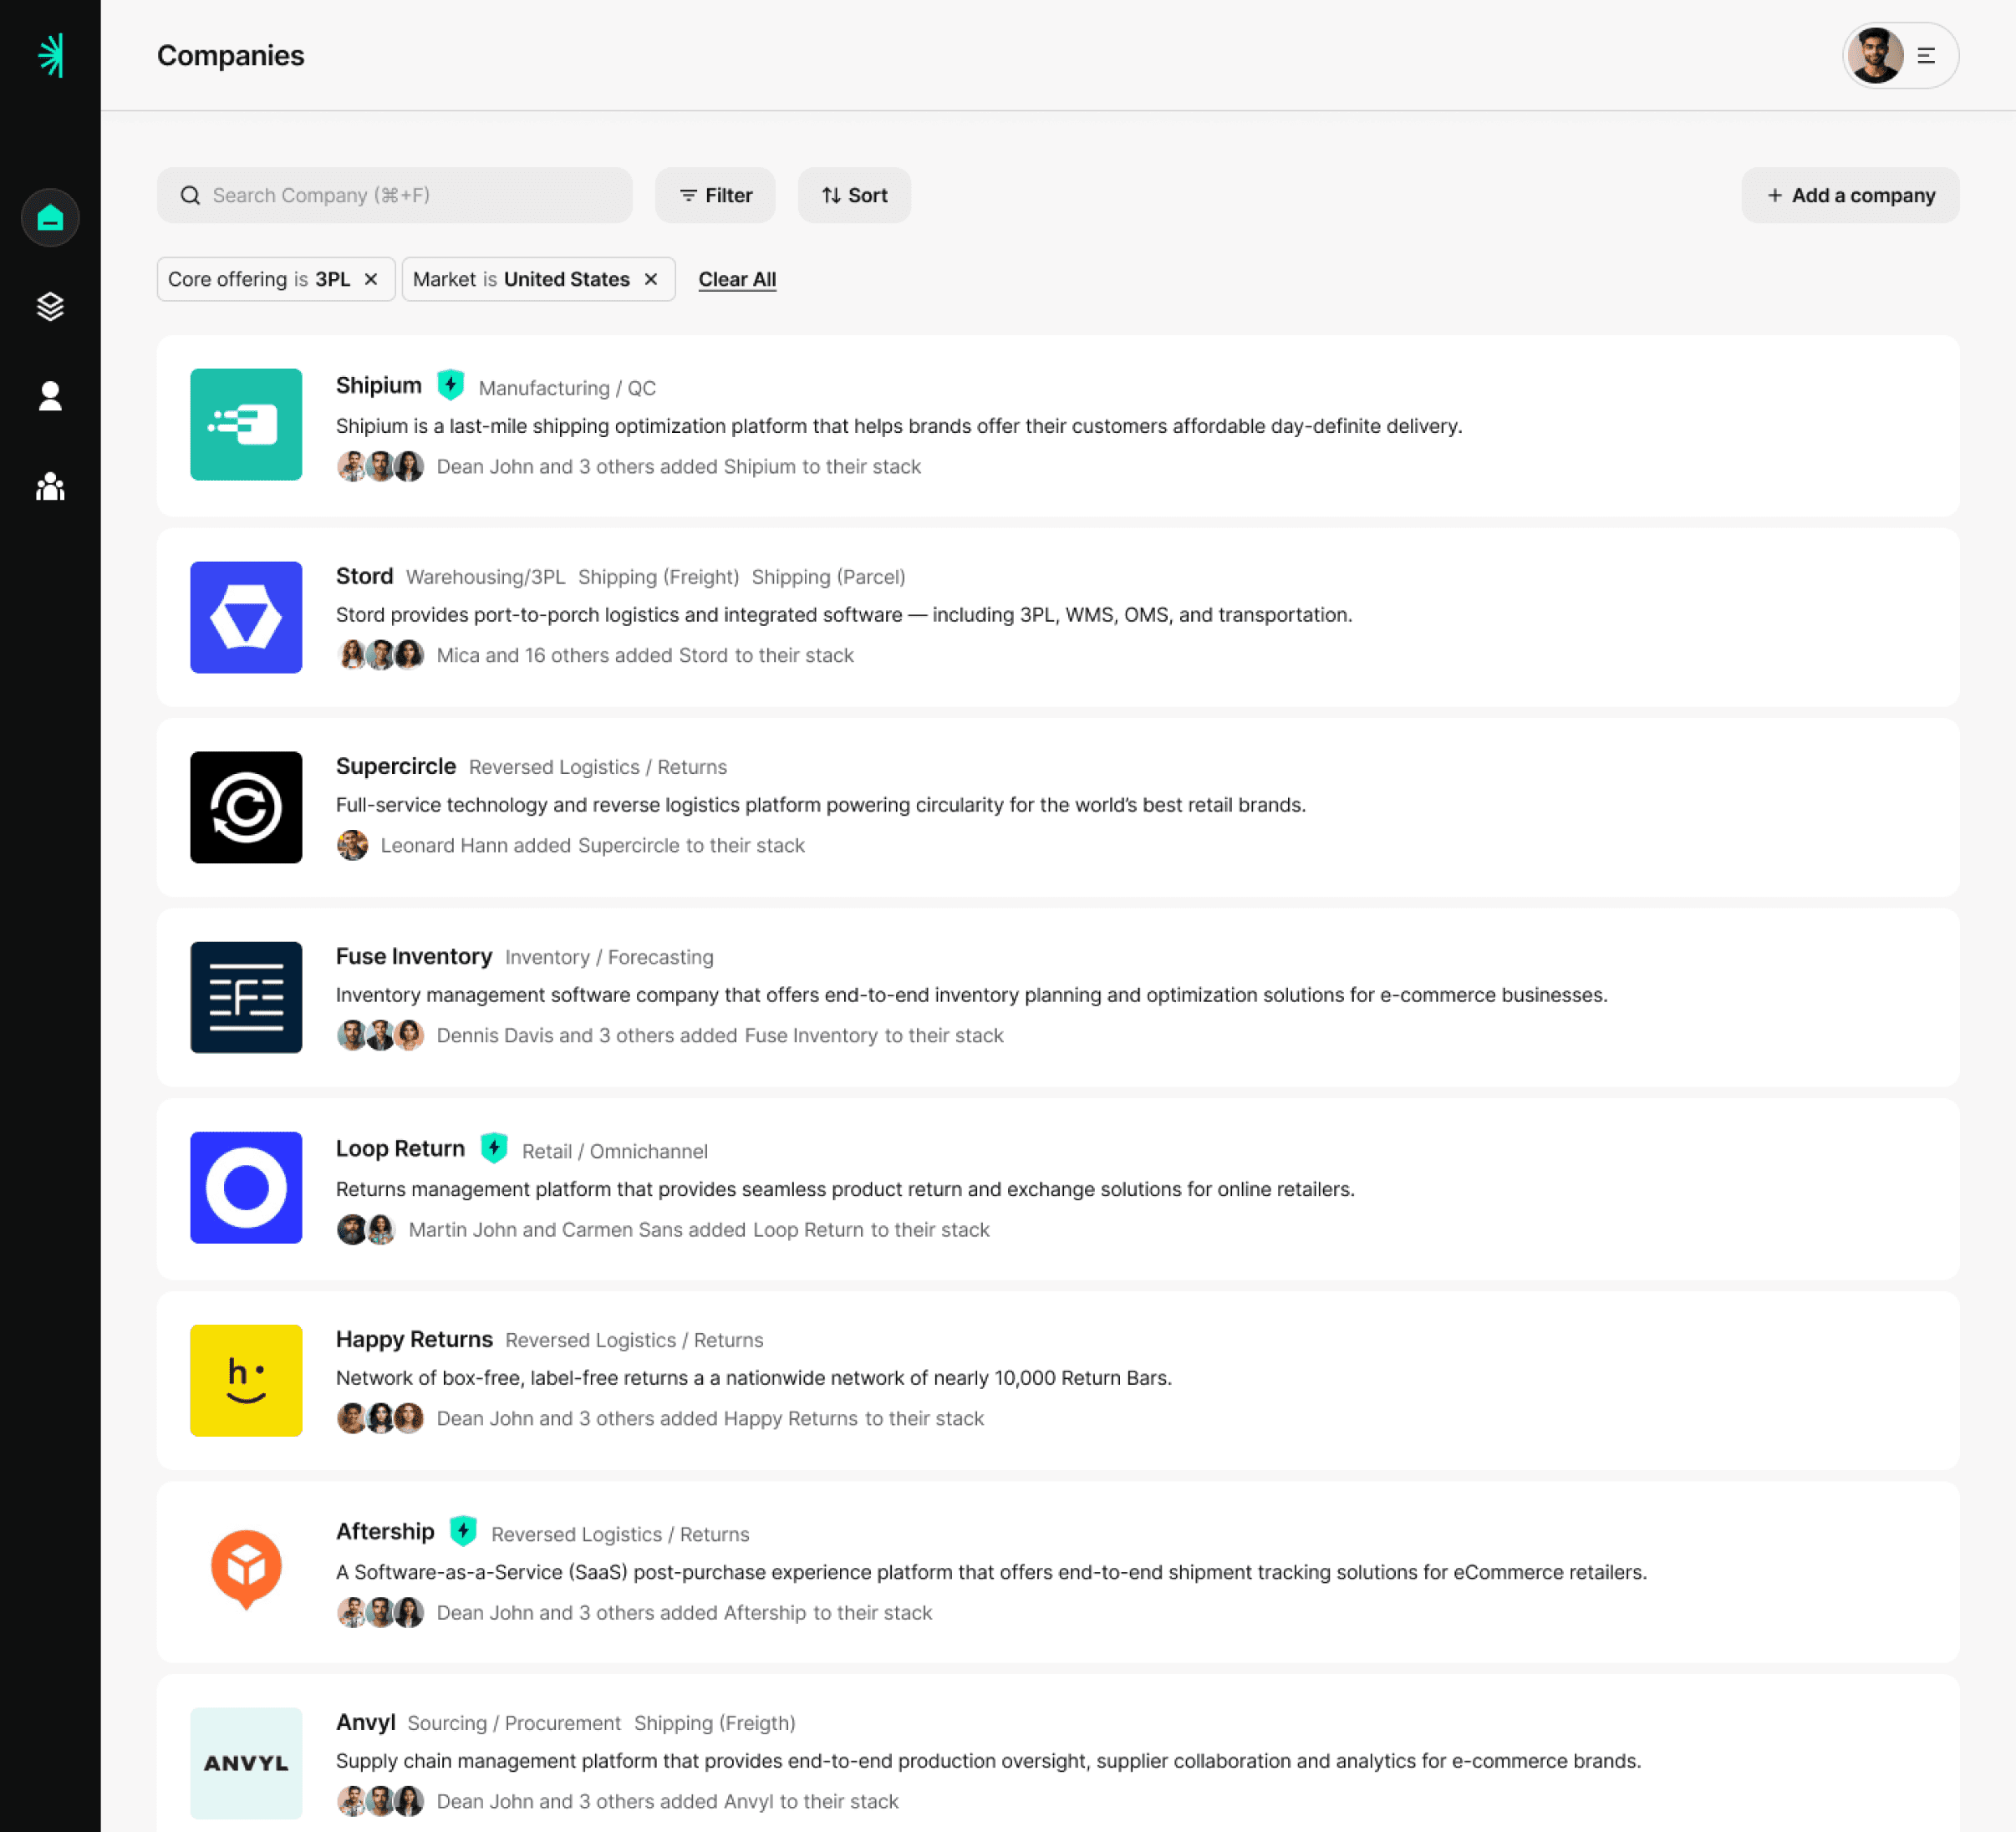
There are already too many tools out there that kind of do what you need. And building custom tools is not as cost prohibitive as it used to be. You should go into a problem thinking that anything is feasible. Nothing is off the table. Because there’s likely a tool or a custom solution that can do what you’re asking.
Amazon famously doesn’t use PowerPoint. Instead, they write multi-page memos. My recommendation for any data challenge is to have that mindset. Don’t try to sell the flash. If you can’t write an essay about the problem you’re facing, you probably don’t have enough detail. The detail is extremely important when deciding what stack to use.
4️⃣ Long term, the sky is the limit
When we enter a data pipeline project with a new client, I try to temper expectations of speed. Going from 0 to 1 on a build takes time and usually many iterations to get right, and it’s best to start small and simple (see Tip 2).
That said, long-term there there is virtually no limit on the possibilities:
Data pipelines and dashboards can give you insight into every single step of your process.
Machine Learning modeled to specific use cases and trained on a lot of relatively clean data can generate forecasts with greater accuracy.
AI Agents can autonomously interact with customers, vendors, and employees. Robotics can automate physical object tasks.
All of this can be achieved with strong data governance, investment in data collection, and strong data models. It takes time. But it is absolutely possible.
5️⃣ Don’t be afraid to pivot
I’m a big fan of the concept of Metric Lifecycle Management. Every metric (outside of standard company accounting) should have an end to it. Similar concepts apply in nearly everything we do.
Unless you’re Coca Cola, there’s a good chance that your recipe or Bill of Material has changed over the last 20 years, or will change in the next 20. So don’t be afraid to switch things up.
Nathan's stack
Nathan was also kind enough to share a few of his favorite tools for building data pipelines:
Data warehouses and data lakes — Snowflake, Databricks
Data visualization — PowerBI, Tableau, Quicksight
Cloud computing — AWS
ERP — Microsoft Dynamics Business Central
Did you find these tips useful? Follow Nathan on LinkedIn to learn more from him. And subscribe to the StartOps newsletter to catch future articles like this one.


